Ex. 10.4
Ex. 10.4
(a) Write a program implementing AdaBoost with trees.
(b) Redo the computations for the example of Figure 10.2. Plot the training error as well as test error, and discuss its behavior.
(c) Investigate the number of iterations needed to make the test error finally start to rise.
(d) Change the setup of this example as follows: define two classes, with the features in Class 1 being \(X_1, X_2, ..., X_{10}\), standard independent Gaussian variates. In Class 2, the features \(X_1, X_2,...,X_{10}\) are also standard independent Gaussian, but conditioned on the event \(\sum_{j} X_j^2 > 12\). Now the classes have significant overlap in feature space. Repeat the AdaBoost experiments as in Figure 10.2 and discuss the results.
Soln. 10.4
As shown in Figure 1, the train and test errors decrease as the number of iterations increases. For train error, it becomes close to zero when the number of iterations exceeds ~150. For test error, it stablizes at ~0.07 when the number of iterations exceeds 300. I didn't observe a rise on test error in my simulation, where the largest number of iterations is 800.
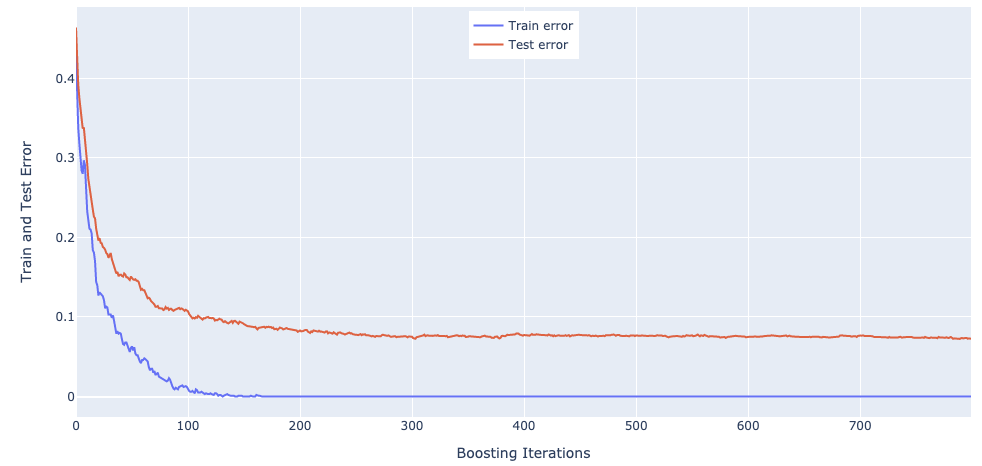
Figure 1: Train and Test Errors of AdaBoost with Trees
Code
 1
 2
 3
 4
 5
 6
 7
 8
 9
10
11
12
13
14
15
16
17
18
19
20
21
22
23
24
25
26
27
28
29
30
31
32
33
34
35
36
37
38
39
40
41
42
43
44
45
46
47
48
49
50
51
52
53
54
55
56
57
58
59
60
61
62
63 | import numpy as np
from sklearn.ensemble import AdaBoostClassifier
import plotly.graph_objects as go
p = 10
mean = np.zeros(p)
cov = np.identity(p)
def classify(X):
if np.linalg.norm(X) > np.sqrt(9.34):
return 1
else:
return -1
n_train = 1000
X_train = np.random.multivariate_normal(mean, cov, n_train)
y_train = np.apply_along_axis(classify, 1, X_train)
n_test = 10000
X_test = np.random.multivariate_normal(mean, cov, n_test)
y_test = np.apply_along_axis(classify, 1, X_test)
num_iterations = 800
test_errors = []
train_errors = []
for i in range(num_iterations):
i += 800
clf = AdaBoostClassifier(n_estimators=i+1, random_state=0)
clf.fit(X_train, y_train)
train_error = 1 - clf.score(X_train, y_train)
train_errors.append(train_error)
test_error = 1 - clf.score(X_test, y_test)
test_errors.append(test_error)
print('Num. of Iteration is {}, Train Error is:{}, Test Error is: {}'.format(i+1, train_error, test_error))
# Create traces
fig = go.Figure()
fig.add_trace(go.Scatter(x=np.arange(num_iterations), y=np.asarray(train_errors),
mode='lines',
name='Train error'))
fig.add_trace(go.Scatter(x=np.arange(num_iterations), y=np.asarray(test_errors),
mode='lines',
name='Test error'))
fig.update_layout(
xaxis_title="Boosting Iterations",
yaxis_title="Train and Test Error",
)
fig.update_layout(legend=dict(
yanchor="top",
y=0.99,
xanchor="center",
x=0.5
))
fig.show()
|