Ex. 15.6
Ex. 15.6
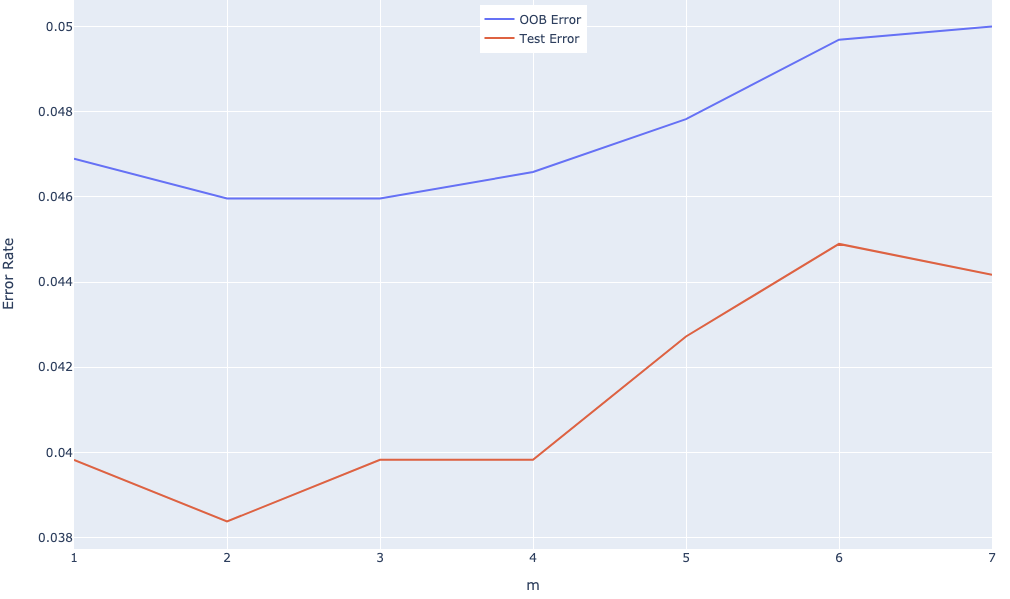
Fit a series of random-forest classifiers to the spam data, to explore the sensitivity to the parameter \(m\). Plot both the oob error as well as the test error against a suitably chosen range of values for \(m\).
Soln. 15.6
Figure 1 below shows the sensitivity to the parameter \(m\), whose values are chosen from 1 to \(\sqrt{p}\approx 8\) (the square root of the number of variables). We see that OOB errors are consistent greater than test errors but have a similar trend.