  1
  2
  3
  4
  5
  6
  7
  8
  9
 10
 11
 12
 13
 14
 15
 16
 17
 18
 19
 20
 21
 22
 23
 24
 25
 26
 27
 28
 29
 30
 31
 32
 33
 34
 35
 36
 37
 38
 39
 40
 41
 42
 43
 44
 45
 46
 47
 48
 49
 50
 51
 52
 53
 54
 55
 56
 57
 58
 59
 60
 61
 62
 63
 64
 65
 66
 67
 68
 69
 70
 71
 72
 73
 74
 75
 76
 77
 78
 79
 80
 81
 82
 83
 84
 85
 86
 87
 88
 89
 90
 91
 92
 93
 94
 95
 96
 97
 98
 99
100
101
102
103
104
105
106
107
108
109
110
111
112
113
114
115
116
117
118
119
120
121
122
123
124
125
126
127
128
129
130
131
132
133
134
135
136
137
138
139
140
141
142
143
144
145
146
147
148
149
150
151
152
153
154
155
156
157
158
159
160
161
162
163
164
165
166
167
168
169
170
171
172 | import numpy as np
from sklearn.neighbors import KNeighborsClassifier
from sklearn.model_selection import cross_val_score
import plotly.graph_objects as go
# Prepare data
def generateData(train_size=100, test_size=1000, p=10):
X_train = np.random.uniform(0, 1, size=(train_size, p))
X_test = np.random.uniform(0, 1, size=(test_size, p))
y_train_easy = generateYEasy(X_train)
y_train_hard = generateYHard(X_train)
y_test_easy = generateYEasy(X_test)
y_test_hard = generateYHard(X_test)
data_easy = {
'X_train': X_train,
'y_train': y_train_easy,
'X_test': X_test,
'y_test': y_test_easy
}
data_hard = {
'X_train': X_train,
'y_train': y_train_hard,
'X_test': X_test,
'y_test': y_test_hard
}
return [data_easy, data_hard]
def generateYEasy(X):
y = X[:, 0].copy()
y[y < 0.5] = 0
y[y > 0.5] = 1
return y
def generateYHard(X):
y = X[:, 0].copy()
for i in range(X.shape[0]):
prod = 1
for j in range(3):
prod *= (X[i, j] - 0.5)
if prod > 0:
y[i] = 1
else:
y[i] = 0
return y
# a utility function to calculate error rate
# of predictions
def getErrorRate(a, b):
return np.sum(a != b) / a.size
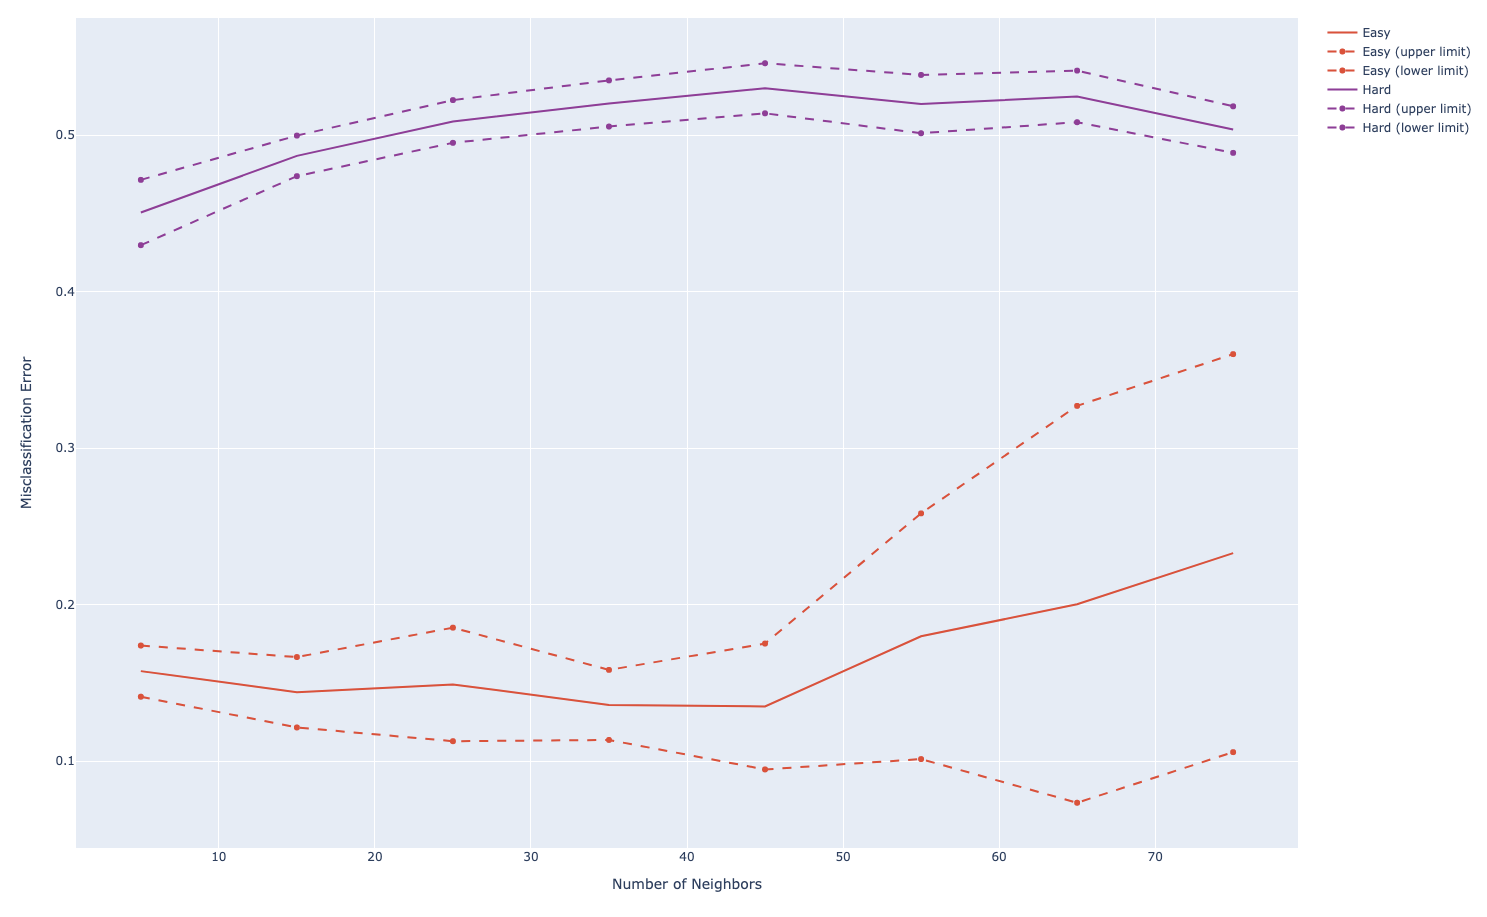
# 1. Replicate Figure 13.5
def getErrorsKNN(num_neighbor=None, data=None):
clf = KNeighborsClassifier(n_neighbors=num_neighbor)
clf.fit(data['X_train'], data['y_train'])
y_predict = clf.predict(data['X_test'])
return getErrorRate(y_predict, data['y_test'])
n_neighbors = np.arange(5, 80, 10)
n_iterations = 10
error_mean_easy_list = []
error_std_easy_list = []
error_mean_hard_list = []
error_std_hard_list = []
for n_neighbor in n_neighbors:
print('Number of Neighbors is: {}'.format(n_neighbor))
tmp_errs_easy = []
tmp_errs_hard = []
for n_ite in range(n_iterations):
print('Running {}-th realization...'.format(n_ite+1))
[data_easy, data_hard] = generateData()
tmp_errs_easy.append(getErrorsKNN(n_neighbor, data_easy))
tmp_errs_hard.append(getErrorsKNN(n_neighbor, data_hard))
error_mean_easy_list.append(np.mean(np.asarray(tmp_errs_easy)))
error_std_easy_list.append(np.std(np.asarray(tmp_errs_easy)))
error_mean_hard_list.append(np.mean(np.asarray(tmp_errs_hard)))
error_std_hard_list.append(np.std(np.asarray(tmp_errs_hard)))
# Create traces
fig = go.Figure()
easy_color = '#eb4034'
hard_color = '#993399'
fig.add_trace(go.Scatter(x=n_neighbors, y=error_mean_easy_list,
mode='lines',
name='Easy',
line_color=easy_color
))
fig.add_trace(go.Scatter(x=n_neighbors, y=np.asarray(error_mean_easy_list)+np.asarray(error_std_easy_list),
mode='lines+markers', name='Easy (upper limit)',
line_color=easy_color, line={'dash': 'dash'}
))
fig.add_trace(go.Scatter(x=n_neighbors, y=np.asarray(error_mean_easy_list)-np.asarray(error_std_easy_list),
mode='lines+markers', name='Easy (lower limit)',
line_color=easy_color, line={'dash': 'dash'}
))
fig.add_trace(go.Scatter(x=n_neighbors, y=error_mean_hard_list,
mode='lines', name='Hard',
line_color=hard_color))
fig.add_trace(go.Scatter(x=n_neighbors, y=np.asarray(error_mean_hard_list)+np.asarray(error_std_hard_list),
mode='lines+markers', name='Hard (upper limit)',
line_color=hard_color, line={'dash': 'dash'}
))
fig.add_trace(go.Scatter(x=n_neighbors, y=np.asarray(error_mean_hard_list)-np.asarray(error_std_hard_list),
mode='lines+markers', name='Hard (lower limit)',
line_color=hard_color, line={'dash': 'dash'}
))
fig.update_layout(
xaxis_title="Number of Neighbors",
yaxis_title="Misclassification Error",
)
fig.show()
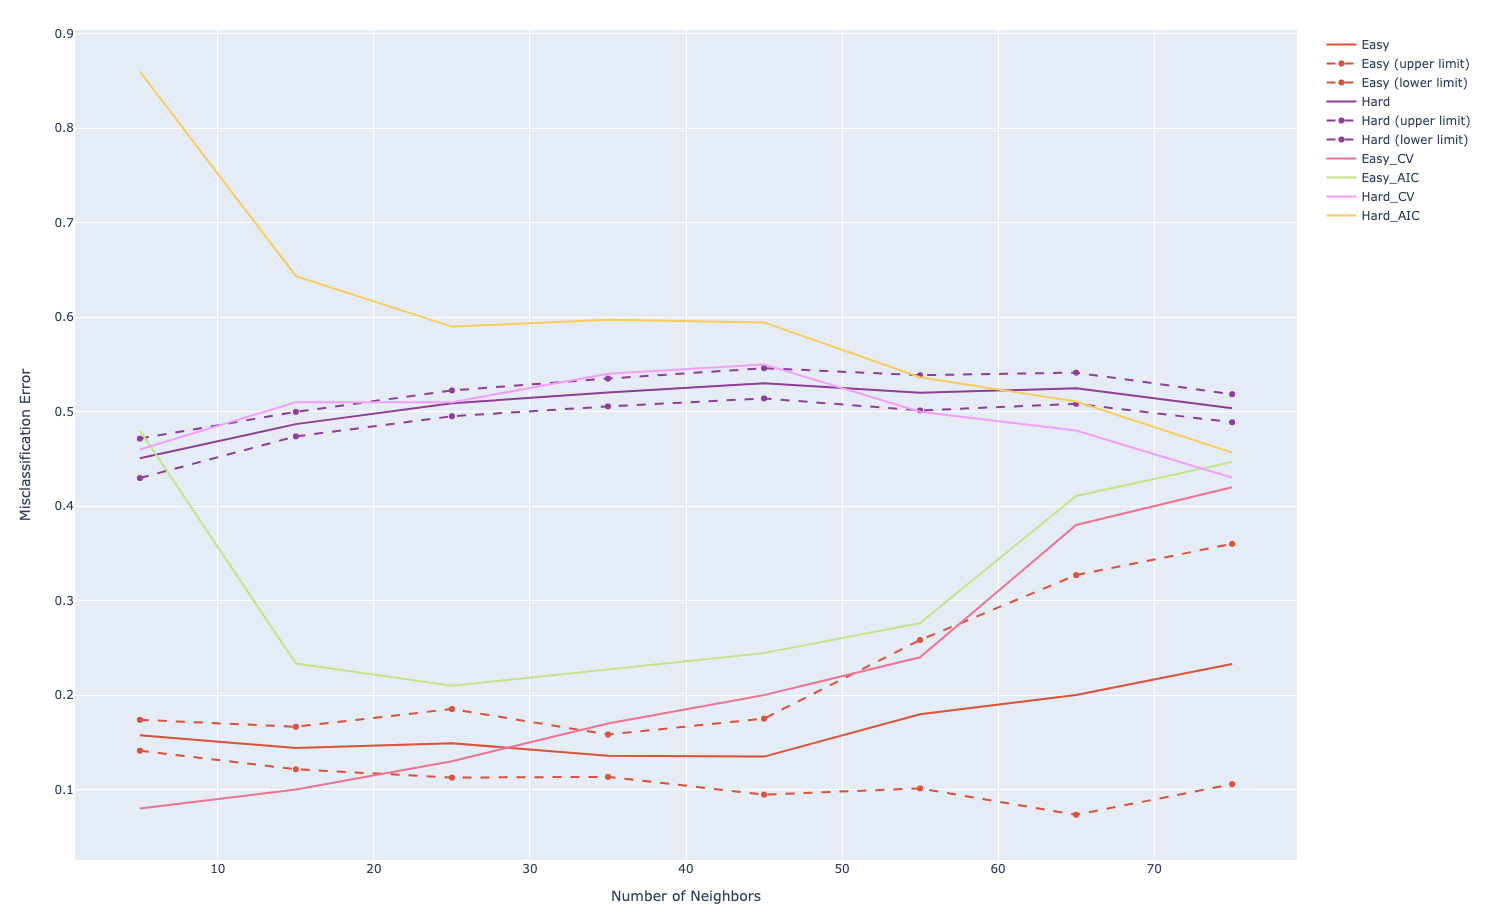
# 2 and 3, five-fold CV and AIC
error_mean_easy_cv_list = []
error_mean_hard_cv_list = []
error_mean_easy_AIC_list = []
error_mean_hard_AIC_list = []
[data_easy, data_hard] = generateData()
for n_neighbor in n_neighbors:
print('CV=5, Number of Neighbors is: {}'.format(n_neighbor))
clf = KNeighborsClassifier(n_neighbors=n_neighbor)
scores_easy = cross_val_score(clf, data_easy['X_train'], data_easy['y_train'], scoring='accuracy', cv=5)
scores_hard = cross_val_score(clf, data_hard['X_train'], data_hard['y_train'], scoring='accuracy', cv=5)
error_mean_easy_cv_list.append(1 - np.mean(scores_easy))
error_mean_easy_AIC_list.append(1 - np.mean(scores_easy) + 2/n_neighbor)
error_mean_hard_cv_list.append(1 - np.mean(scores_hard))
error_mean_hard_AIC_list.append(1 - np.mean(scores_hard) + 2/n_neighbor)
fig.add_trace(go.Scatter(x=n_neighbors, y=error_mean_easy_cv_list,
mode='lines',
name='Easy_CV'
))
fig.add_trace(go.Scatter(x=n_neighbors, y=error_mean_easy_AIC_list,
mode='lines',
name='Easy_AIC'
))
fig.add_trace(go.Scatter(x=n_neighbors, y=error_mean_hard_cv_list,
mode='lines',
name='Hard_CV'
))
fig.add_trace(go.Scatter(x=n_neighbors, y=error_mean_hard_AIC_list,
mode='lines',
name='Hard_AIC'
))
fig.show()
|